
A new tool for exploring global lead trade data

A quick update: we’ve launched a small dashboard with global lead trade data from 2012 - 2022.
This came out of an internal use case. I’ve been spending a lot of time looking at lead trade data (e.g., for our Nigeria analysis), but wanted to be able to much more quickly pull data for other countries.
Enter… this dashboard.
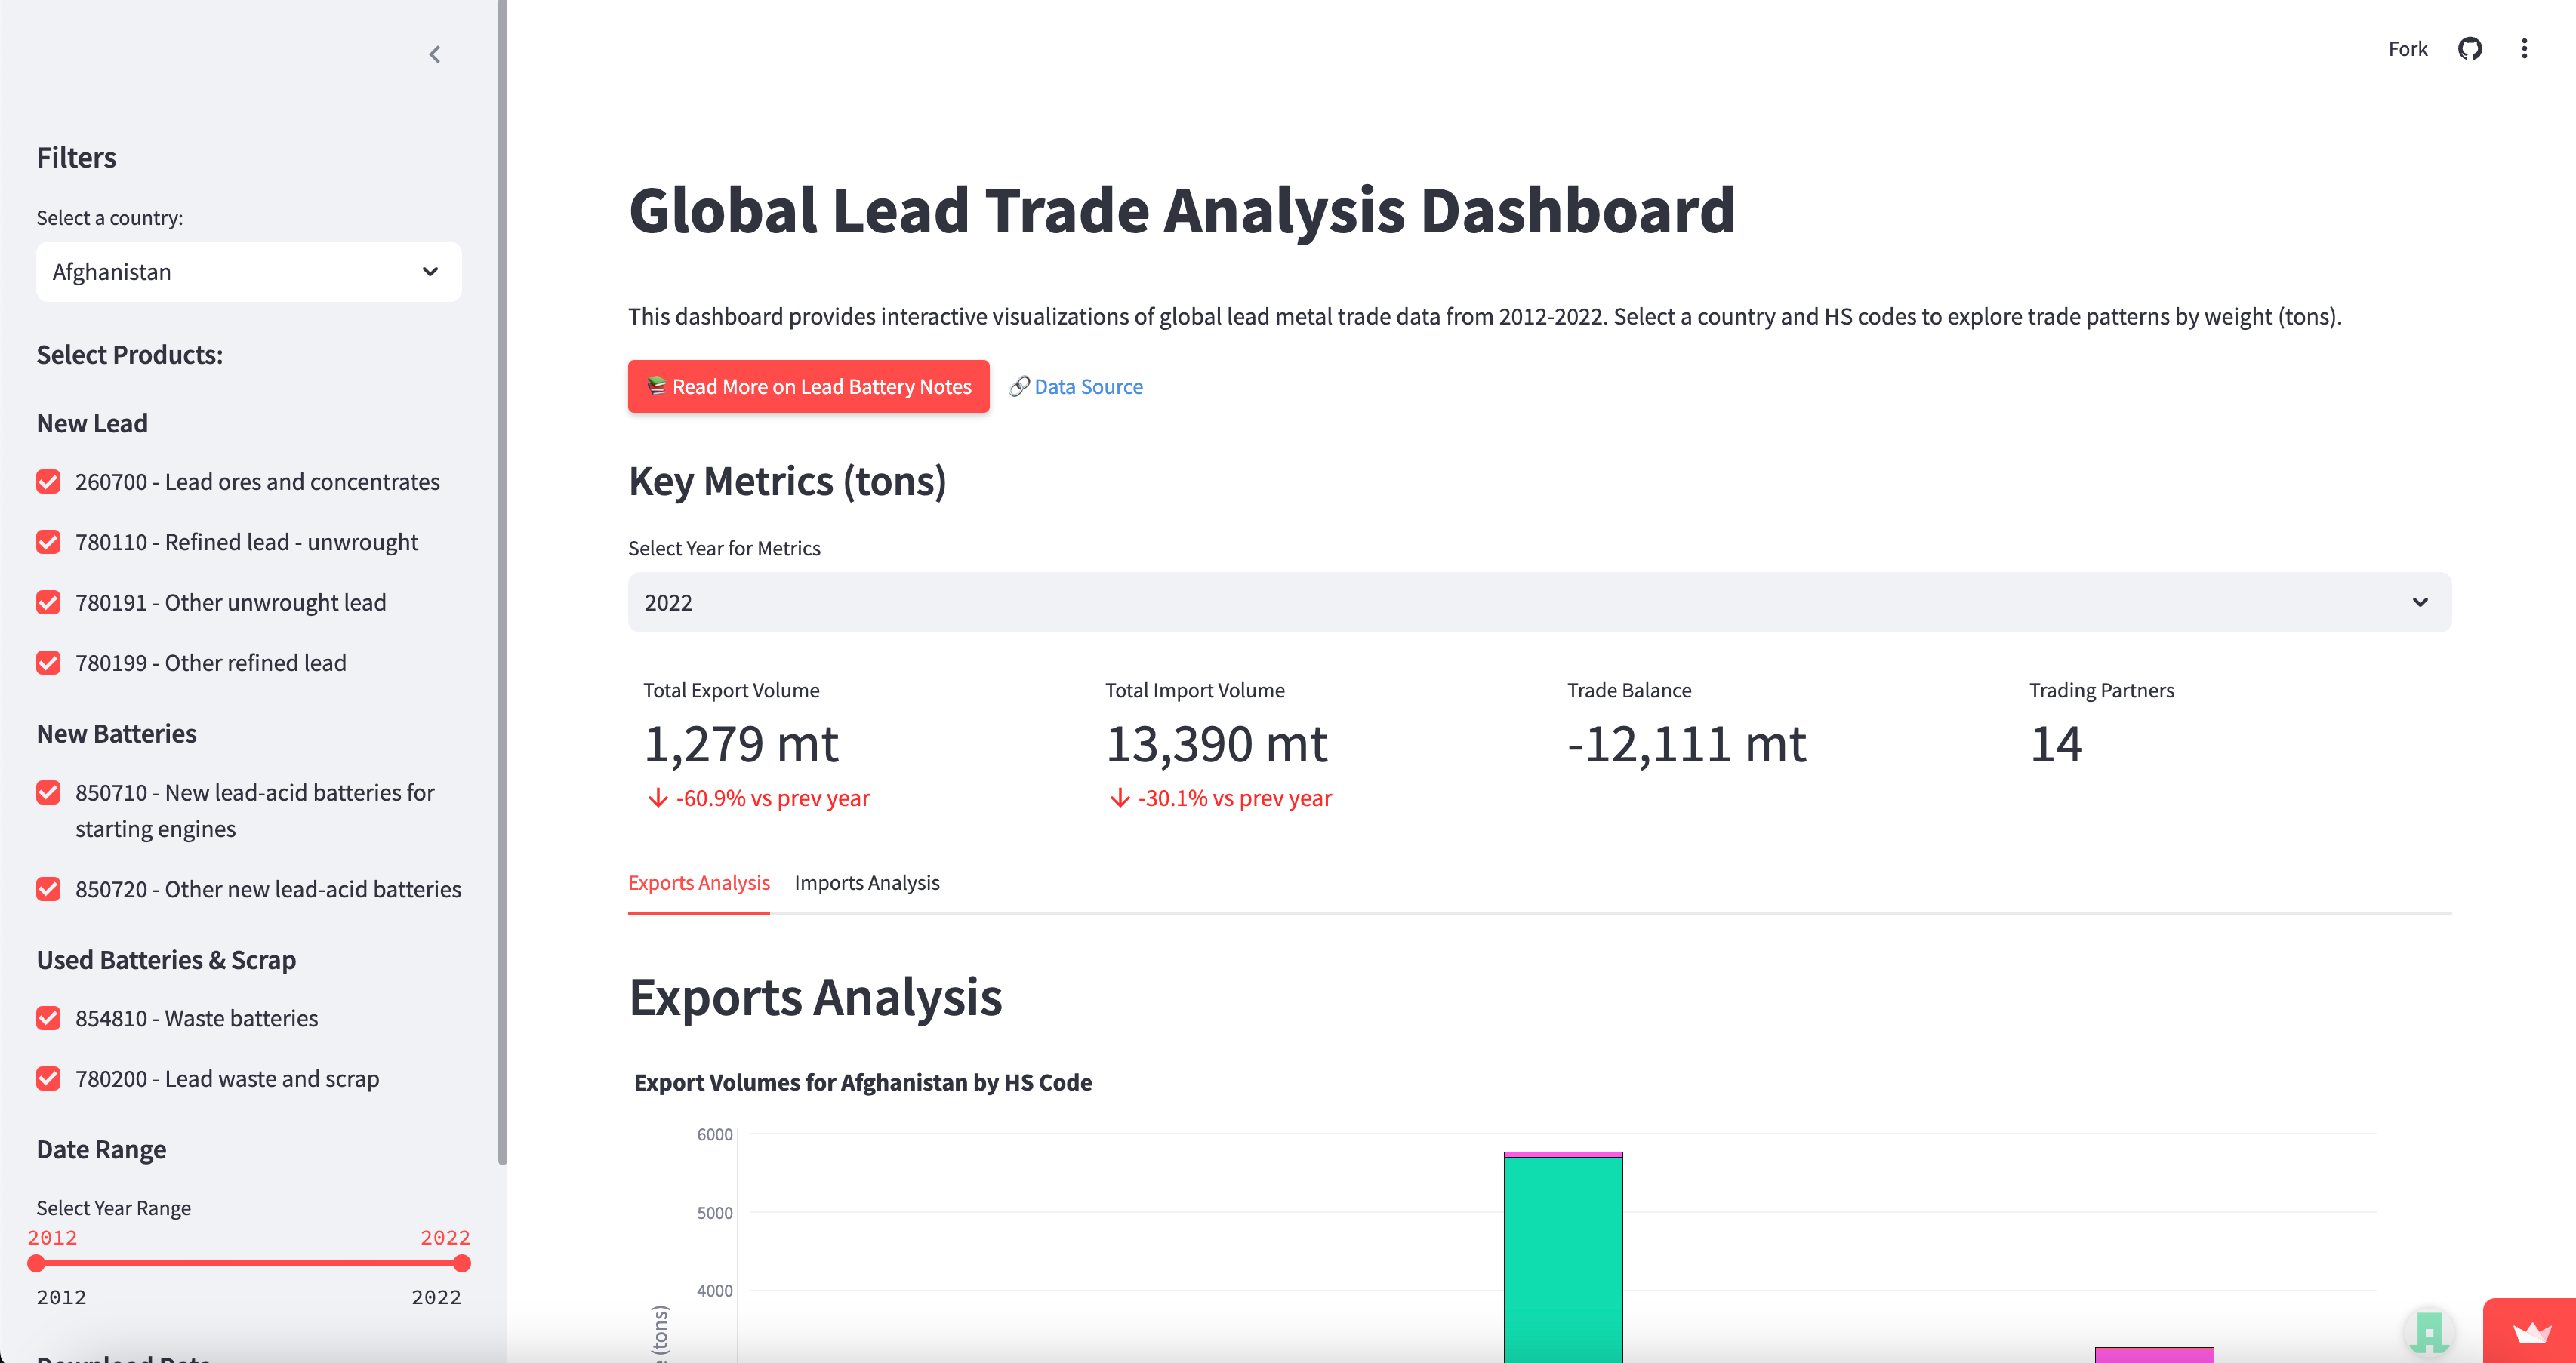
It’s simple right now, but allows you to:
Select the country you want to analyze
Select all relevant Harmonized System (HS) codes
View import and export volumes by weight1 as well as sources and destinations for each year
What can you learn from lead trade data?
This tool is designed to provide quick insight into a given country’s lead trade.
Take Tanzania for example, a country I haven’t spent a lot of time looking at yet:
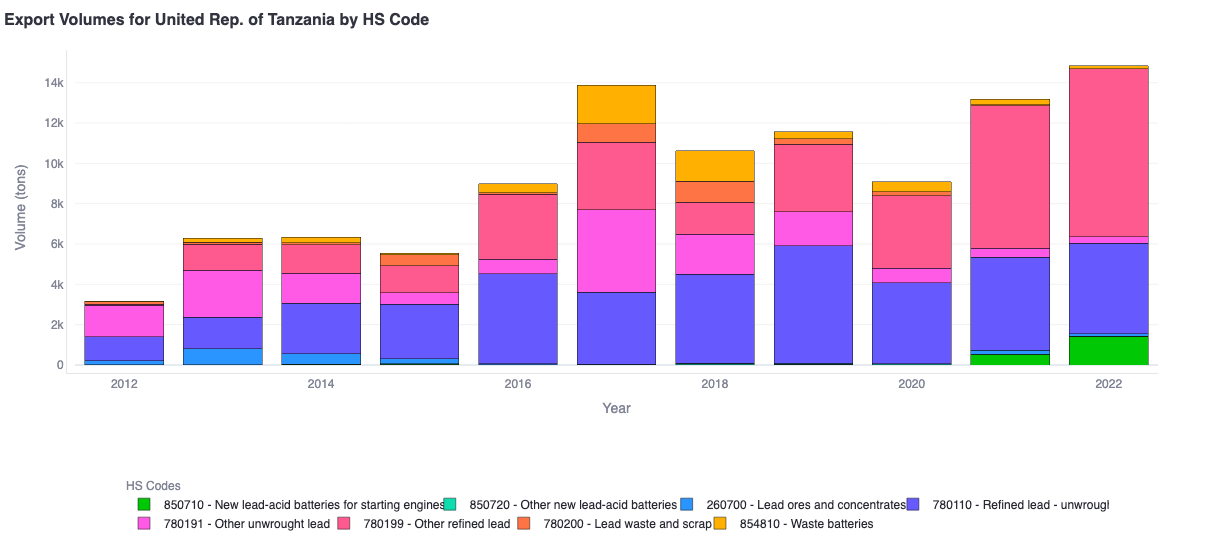
We can see that the vast majority of its exports are refined lead, as well as a small but growing amount of new lead-acid batteries.
However, some quick research reveals that Tanzania doesn’t have substantial lead mining. Consequently, this refined lead is probably coming from ULAB recyclers. Some quick additional research reveals there are in fact several low-standard formal ULAB recyclers in Tanzania, and the Okö Institut is working with regulators to attempt to upgrade standards.
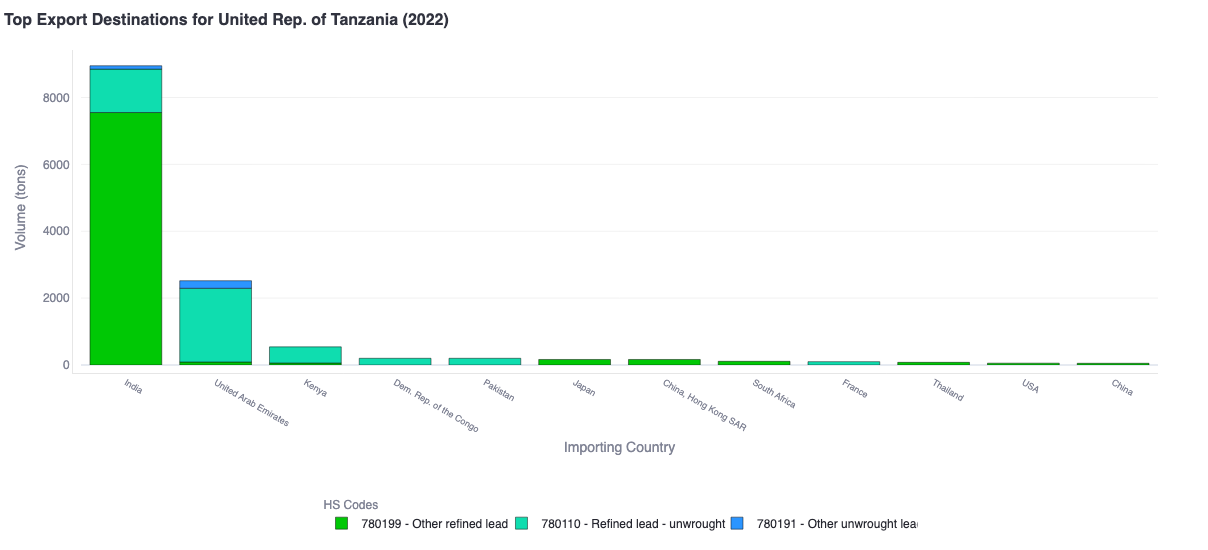
Where is this recycled lead going? Trade data suggests almost entirely to India and the UAE:
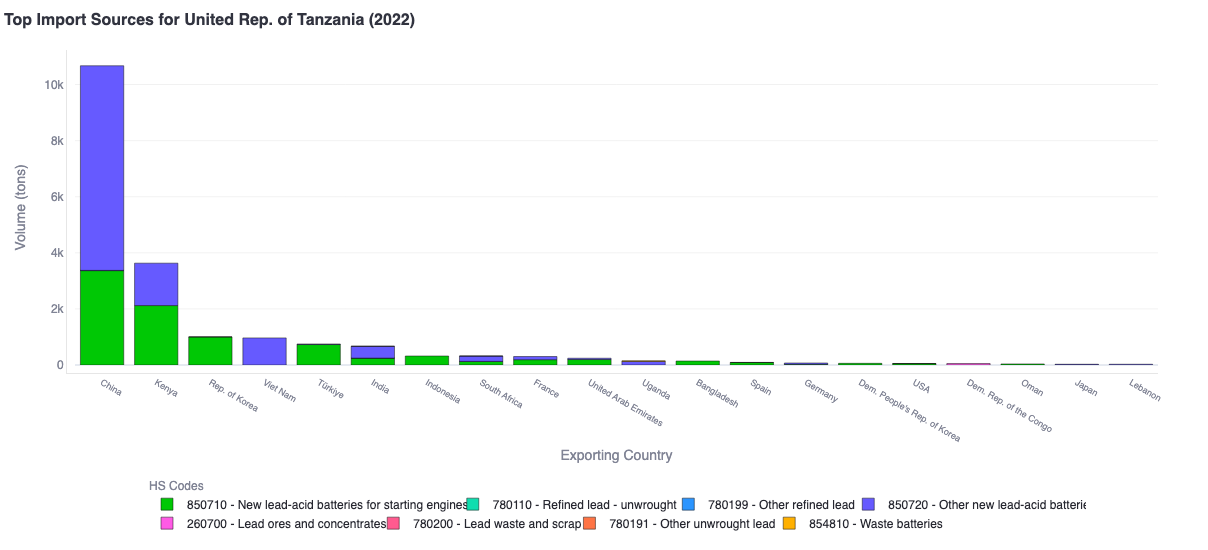
If we want to jump over to look at imports quickly, we can see that it is almost entirely new lead-acid batteries, mostly from China with some from Kenya as well. They used to import some refined lead (and interestingly, in 2015 a decent amount of lead scrap) but this seems to have phased out by 2018.
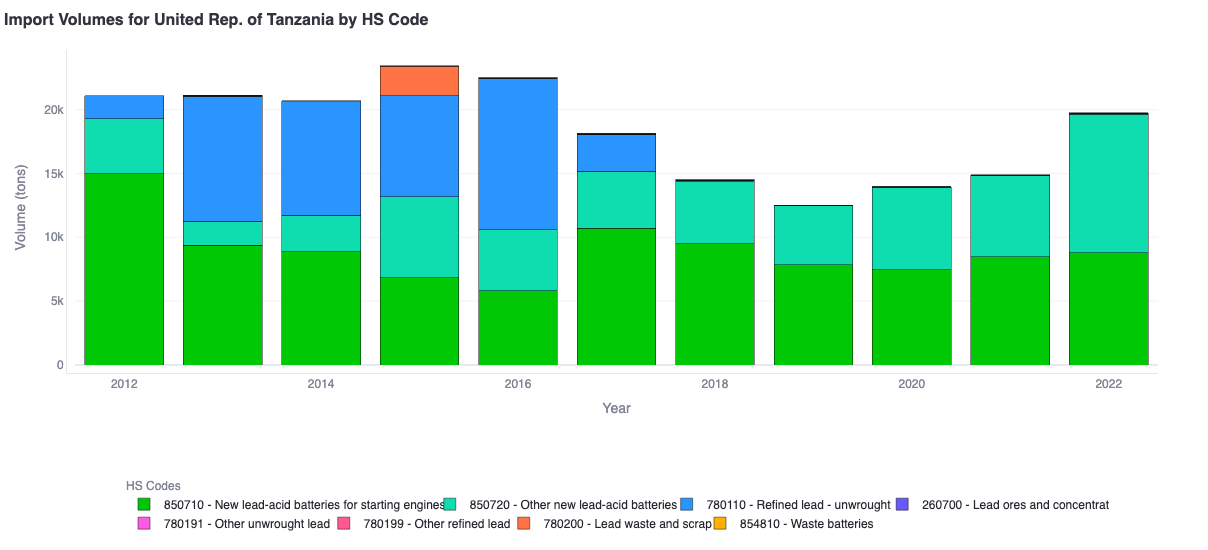
There you have it — in less than 5 minutes, we were able to get a decent preliminary understanding of Tanzania’s lead and lead-acid battery trade.
What’s next for this tool?
This tool is in a very early stage. Some things (e.g., mobile view) don’t work that well and the functionality is very limited.
Depending on how useful this is to people, we’ll probably update the data, add some tools to analyze global trading flows more broadly, and potentially to allow you to dive deeper into specific trading partners.
Have thoughts? Something broken? Send me an email at hugorobertsmith (at) gmail.
What data are you using?
We’re using CEPII’s BACI trade data. This is a reconciled version of the UN’s Comtrade data.
I made a cleaned version of both the BACI and Comtrade data you can access here.
We had tried to use Comtrade directly, but ran into a major problem — a lot of the LMIC trade data didn’t tie. This is because Comtrade data is self-reported by each country, and countries have substantially different levels of accuracy in the data they report.
For example, take a relatively simple question: how many new automotive batteries (HS: 850710) did Nigeria import in 2022?
Using raw Comtrade trade data, Nigeria reported importing $4,309,769 worth of new automotive batteries in 2022
Other countries, however, reported exporting in total $67,973,439 worth of automotive batteries to Nigeria
Some variance in the numbers is to be expected—but in this case, Nigeria is reporting importing 94% less of what other countries report sending it. A similar analysis for the US, meanwhile, has a delta of 9.1%.
The BACI data solves this neatly for us by reconciling each trade flow based on the reliability of the reporting partner. You can read more about their methodology here.
We had a version that allowed you to view reported values too, but there seemed to be large discrepancies for the relevant LMIC data to the point that the reported values were distracting from the underlying trade dynamics.
May add this back in the future.